Our mission is to help computational modelers develop, document, and share their computational models in accordance with community standards and good open science and software engineering practices. Model authors can publish their model source code in the Computational Model Library with narrative documentation as well as metadata that supports open science and emerging norms that facilitate software citation, computational reproducibility / frictionless reuse, and interoperability. Model authors can also request private peer review of their computational models. Models that pass peer review receive a DOI once published.
All users of models published in the library must cite model authors when they use and benefit from their code.
Please check out our model publishing tutorial and feel free to contact us if you have any questions or concerns about publishing your model(s) in the Computational Model Library.
Displaying 3 of 113 results for "Aaron R Weiskittel" clear search
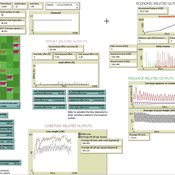
Peer reviewed soslivestock model
Marco Janssen Irene Perez Ibarra Diego J. Soler-Navarro Alicia Tenza Peral | Published Wednesday, May 28, 2025 | Last modified Tuesday, June 10, 2025The purpose of this model is to analyze how different management strategies affect the wellbeing, sustainability and resilience of an extensive livestock system under scenarios of climate change and landscape configurations. For this purpose, it simulates one cattle farming system, in which agents (cattle) move through the space using resources (grass). Three farmer profiles are considered: 1) a subsistence farmer that emphasizes self-sufficiency and low costs with limited attention to herd management practices, 2) a commercial farmer focused on profit maximization through efficient production methods, and 3) an environmental farmer that prioritizes conservation of natural resources and animal welfare over profit maximization. These three farmer profiles share the same management strategies to adapt to climate and resource conditions, but differ in their goals and decision-making criteria for when, how, and whether to implement those strategies. This model is based on the SequiaBasalto model (Dieguez Cameroni et al. 2012, 2014, Bommel et al. 2014 and Morales et al. 2015), replicated in NetLogo by Soler-Navarro et al. (2023).
One year is 368 days. Seasons change every 92 days. Each step begins with the growth of grass as a function of climate and season. This is followed by updating the live weight of animals according to the grass height of their patch, and grass consumption, which is determined based on the updated live weight. Animals can be supplemented by the farmer in case of severe drought. After consumption, cows grow and reproduce, and a new grass height is calculated. This updated grass height value becomes the starting grass height for the next day. Cows then move to the next area with the highest grass height. After that, cattle prices are updated and cattle sales are held on the first day of fall. In the event of a severe drought, special sales are held. Finally, at the end of the day, the farm balance and the farmer’s effort are calculated.
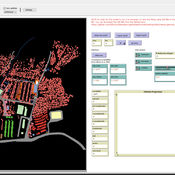
AIforGoodSimulator - Modeling Covid-19 Spread and Potential Interventions in Refugee Camps
Shyaam Ramkumar Woi Sok Oh | Published Thursday, March 18, 2021The Netlogo model is a conceptualization of the Moria refugee camp, capturing the household demographics of refugees in the camp, a theoretical friendship network based on values, and an abstraction of their daily activities. The model then simulates how Covid-19 could spread through the camp if one refugee is exposed to the virus, utilizing transmission probabilities and the stages of disease progression of Covid-19 from susceptible to exposed to asymptomatic / symptomatic to mild / severe to recovered from literature. The model also incorporates various interventions - PPE, lockdown, isolation of symptomatic refugees - to analyze how they could mitigate the spread of the virus through the camp.
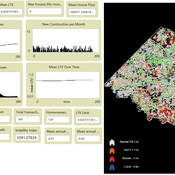
ZIP-Level Housing Supply Elasticity and Crash Dynamics: A GIS-Based Agent-Based Model of the Washington DC and Northern Virginia Metro Region
Mansoor Abdul Bari | Published Saturday, August 01, 2026 | Last modified Sunday, August 02, 2026This model tests whether local housing supply elasticity governs crash severity inside a single metropolitan housing market. Saiz (2010) established that across US metros, regions constrained by geography and regulation experience deeper boom-bust cycles than flexible ones. That finding is routinely applied downward to neighborhoods and ZIP codes as though the mechanism scaled without qualification.
The empirical record for the Washington DC and Northern Virginia region says it does not. Across 84 ZIP codes, measured supply elasticity ranges from 0.35 to 4.95 with a median of 1.21. The worst single-year price decline between 2007 and 2012 averaged 9.6 percent in constrained ZIP codes and 9.0 percent in flexible ones, a gap that cannot be distinguished from noise. Wide variation in the proposed cause, no meaningful separation in the proposed effect.
The model embeds households, houses and a metro-wide credit condition in the real ZIP geography of the region using three GIS layers and an empirical price panel. Local elasticity governs construction, exactly as theory predicts. Prices are driven by a shared macro drift schedule and, under the credit-amplified mode, by a leverage cycle with a financial accelerator and a deviation penalty. The design question is whether those shared forces are sufficient to override local supply differences at the sub-metropolitan scale.
…
Displaying 3 of 113 results for "Aaron R Weiskittel" clear search