Our mission is to help computational modelers develop, document, and share their computational models in accordance with community standards and good open science and software engineering practices. Model authors can publish their model source code in the Computational Model Library with narrative documentation as well as metadata that supports open science and emerging norms that facilitate software citation, computational reproducibility / frictionless reuse, and interoperability. Model authors can also request private peer review of their computational models. Models that pass peer review receive a DOI once published.
All users of models published in the library must cite model authors when they use and benefit from their code.
Please check out our model publishing tutorial and feel free to contact us if you have any questions or concerns about publishing your model(s) in the Computational Model Library.
Displaying 10 of 994 results for "M Van Den Hoven" clear search
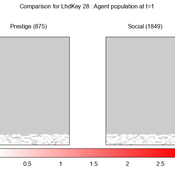
We provide a theory-grounded, socio-geographic agent-based model to present a possible explanation for human movement in the Adriatic region within the Cetina phenomenon.
Focusing on ideas of social capital theory from Piere Bordieu (1986), we implement agent mobility in an abstract geography based on cultural capital (prestige) and social capital (social position). Agents hold myopic representations of social (Schaff, 2016) and geographical networks and decide in a heuristic way on moving (and where) or staying.
The model is implemented in a fork of the Laboratory for Simulation Development (LSD), appended with GIS capabilities (Pereira et. al. 2020).
TunaFisher ABM
Guus Ten Broeke | Published Wednesday, January 13, 2021TunaFisher ABM simulates the decisions of fishing companies and fishing vessels of the Philippine tuna purse seinery operating in the Celebes and Sulu Seas.
High fishing effort remains in many of the world’s fisheries, including the Philippine tuna purse seinery, despite a variety of policies that have been implemented to reduce it. These policies have predominantly focused on models of cause and effect which ignore the possibility that the intended outcomes are altered by social behavior of autonomous agents at lower scales.
This model is a spatially explicit Agent-based Model (ABM) for the Philippine tuna purse seine fishery, specifically designed to include social behavior and to study its effects on fishing effort, fish stock and industry profit. The model includes economic and social factors of decision making by companies and fishing vessels that have been informed by interviews.
…
Demand Planning Model
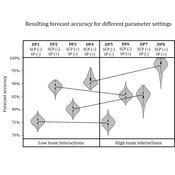
Iris Lorscheid Jonas Hauke Matthias Meyer | Published Wednesday, October 04, 2017Demand planning requires processing of distributed information. In this process, individuals, their properties and interactions play a crucial role. This model is a computational testbed to investigate these aspects with respect to forecast accuracy.
Kulayinjana
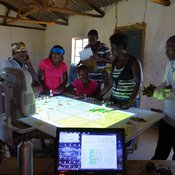
Christophe Le Page Arthur Perrotton Michel De Garine-Wichatitsky Barry Bitu Killion Koyisi Ferdinand Mwamba Cephus Ncube Victor Ncube Siphusisiwe Ndlovu Raphael Ngwenya Ambu Nyathi Fumbane Nyathi Patrick Sibanda Zenzo Sibanda | Published Monday, October 03, 2016a computer-based role-playing game simulating the interactions between farming activities, livestock herding and wildlife in a virtual landscape reproducing local socioecological dynamics at the periphery of Hwange National Park (Zimbabwe).
Alternative scenarios of green consumption in Italy: an empirically grounded model.
Giangiacomo Bravo Elena Vallino Alessandro K Cerutti Maria Beatrice Pairotti | Published Thursday, March 28, 2013 | Last modified Saturday, April 27, 2013We provide a full description of the model following the ODD protocol (Grimm et al. 2010) in the attached document. The model is developed in NetLogo 5.0 (Wilenski 1999).
Peer reviewed Gradient Descent Simulation
Ilyes Azouani | Published Wednesday, March 18, 2026 | Last modified Monday, May 25, 2026This model visualizes gradient descent optimization - the fundamental algorithm used to train neural networks and other machine learning models. Agents represent different optimization algorithms searching for the minimum of a loss landscape (the “error surface” that ML models try to minimize during training).
The model demonstrates how different optimizer types (SGD, Momentum with different parameters) behave on various loss landscapes, from simple bowls to the notoriously difficult Rosenbrock “banana valley” function. This helps build intuition about why certain optimization algorithms work better than others for different problem geometries.
HOW IT WORKS
…

Coupled Housing and Land Markets (CHALMS)
Nicholas Magliocca Virginia Mcconnell Margaret Walls | Published Friday, November 02, 2012 | Last modified Monday, October 27, 2014CHALMS simulates housing and land market interactions between housing consumers, developers, and farmers in a growing ex-urban area.
A simplified Arthur & Polak logic circuit model of combinatory technology build-out via incremental development. Only some inventions trigger radical effects, suggesting they depend on whole interdependent systems rather than specific innovations.
The Urban Drought Nexus Tool
Roger Cremades Muhamad Khairulbahri | Published Thursday, December 14, 2023The “Urban Drought Nexus Tool” is a system dynamics model, aiming to facilitate the co-development of climate services for cities under increasing droughts. The tool integrates multiple types of information and still can be applied to other case studies with minimal adjustments on the parameters of land use, water consumption and energy use in the water sector. The tool needs hydrological projections under climate scenarios to evaluate climatic futures, and requires the co-creation of socio-economic future scenarios with local stakeholders. Thus it is possible to provide specific information about droughts taking into account future water availability and future water consumption. Ultimately, such complex system as formed by the water-energy-land nexus can be reduced to single variables of interest, e.g. the number of events with no water available in the future and their length, so that the complexities are reduced and the results can be conveyed to society in an understandable way, including the communication of uncertainties. The tool and an explanatory guide in pdf format are included. Planned further developments include calibrating the system dynamics model with the social dynamics behind each flow with agent-based models.

LimnoSES - social-ecological lake management undergoing regime shifts
Romina Martin | Published Thursday, November 24, 2016 | Last modified Friday, January 18, 2019LimnoSES is a coupled system dynamics, agent-based model to simulate social-ecological feedbacks in shallow lake use and management.
Displaying 10 of 994 results for "M Van Den Hoven" clear search