Our mission is to help computational modelers develop, document, and share their computational models in accordance with community standards and good open science and software engineering practices. Model authors can publish their model source code in the Computational Model Library with narrative documentation as well as metadata that supports open science and emerging norms that facilitate software citation, computational reproducibility / frictionless reuse, and interoperability. Model authors can also request private peer review of their computational models. Models that pass peer review receive a DOI once published.
All users of models published in the library must cite model authors when they use and benefit from their code.
Please check out our model publishing tutorial and feel free to contact us if you have any questions or concerns about publishing your model(s) in the Computational Model Library.
Displaying 10 of 229 results for "Martin Dribe" clear search
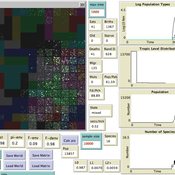
A test-bed ecological model
Bruce Edmonds | Published Sunday, May 04, 2014 | Last modified Wednesday, May 15, 2019This is a multi-patch meta-population ecological model. It intended as a test-bed in which to test the impact of humans with different kinds of social structure.
Vulnerability of Cooperation Due to Limited Vision
Marco Janssen | Published Thursday, December 02, 2010 | Last modified Saturday, April 27, 2013This model describes the consequences of limited vision of agents in harvesting a common resource. We show the vulnerability of cooperation due to reduced visibility of the resource and other agents.
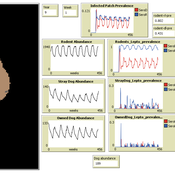
Peer reviewed MHMSLeptoDy (Multi-host, multi-serovar Leptospira Dynamics Model)
Aniruddha Belsare Matthew Gompper Meghan Mason Claudia Munoz-Zanzi | Published Tuesday, January 29, 2019 | Last modified Tuesday, March 12, 2019Leptospirosis is a neglected, bacterial zoonosis with worldwide distribution, primarily a disease of poverty. More than 200 pathogenic serovars of Leptospira bacteria exist, and a variety of species may act as reservoirs for these serovars. Human infection is the result of direct or indirect contact with Leptospira bacteria in the urine of infected animal hosts, primarily livestock, dogs, and rodents. There is increasing evidence that dogs and dog-adapted serovar Canicola play an important role in the burden of leptospirosis in humans in marginalized urban communities. What is needed is a more thorough understanding of the transmission dynamics of Leptospira in these marginalized urban communities, specifically the relative importance of dogs and rodents in the transmission of Leptospira to humans. This understanding will be vital for identifying meaningful intervention strategies.
One of the main objectives of MHMSLeptoDy is to elucidate transmission dynamics of host-adapted Leptospira strains in multi-host system. The model can also be used to evaluate alternate interventions aimed at reducing human infection risk in small-scale communities like urban slums.
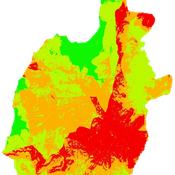
SiFlo: An Agent-based Model to simulate inhabitants’ behavior during a flood event
Patrick Taillandier Franck Taillandier Pascal Di Maiolo Rasool Mehdizadeh | Published Thursday, July 29, 2021SiFlo is an ABM dedicated to simulate flood events in urban areas. It considers the water flowing and the reaction of the inhabitants. The inhabitants would be able to perform different actions regarding the flood: protection (protect their house, their equipment and furniture…), evacuation (considering traffic model), get and give information (considering imperfect knowledge), etc. A special care was taken to model the inhabitant behavior: the inhabitants should be able to build complex reasoning, to have emotions, to follow or not instructions, to have incomplete knowledge about the flood, to interfere with other inhabitants, to find their way on the road network. The model integrates the closure of roads and the danger a flooded road can represent. Furthermore, it considers the state of the infrastructures and notably protection infrastructures as dyke. Then, it allows to simulate a dyke breaking.
The model intends to be generic and flexible whereas provide a fine geographic description of the case study. In this perspective, the model is able to directly import GIS data to reproduce any territory. The following sections expose the main elements of the model.
This model presents an autonomous, two-lane driving environment with a single lane-closure that can be toggled. The four driving scenarios - two baseline cases (based on the real-world) and two experimental setups - are as follows:
- Baseline-1 is where cars are not informed of the lane closure.
- Baseline-2 is where a Red Zone is marked wherein cars are informed of the lane closure ahead.
- Strategy-1 is where cars use a co-operative driving strategy - FAS. <sup>[1]</sup>
- Strategy-2 is a variant of Strategy-1 and uses comfortable deceleration values instead of the vehicle’s limit.
…
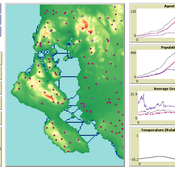
This model extends the original Artifical Anasazi (AA) model to include individual agents, who vary in age and sex, and are aggregated into households. This allows more realistic simulations of population dynamics within the Long House Valley of Arizona from AD 800 to 1350 than are possible in the original model. The parts of this model that are directly derived from the AA model are based on Janssen’s 1999 Netlogo implementation of the model; the code for all extensions and adaptations in the model described here (the Artificial Long House Valley (ALHV) model) have been written by the authors. The AA model included only ideal and homogeneous “individuals” who do not participate in the population processes (e.g., birth and death)–these processes were assumed to act on entire households only. The ALHV model incorporates actual individual agents and all demographic processes affect these individuals. Individuals are aggregated into households that participate in annual agricultural and demographic cycles. Thus, the ALHV model is a combination of individual processes (birth and death) and household-level processes (e.g., finding suitable agriculture plots).
As is the case for the AA model, the ALHV model makes use of detailed archaeological and paleoenvironmental data from the Long House Valley and the adjacent areas in Arizona. It also uses the same methods as the original model (from Janssen’s Netlogo implementation) to estimate annual maize productivity of various agricultural zones within the valley. These estimates are used to determine suitable locations for households and farms during each year of the simulation.
Artificial Long House Valley-Black Mesa
Lisa Sattenspiel Amy Warren | Published Thursday, March 19, 2020This model is an extension of the Artificial Long House Valley (ALHV) model developed by the authors (Swedlund et al. 2016; Warren and Sattenspiel 2020). The ALHV model simulates the population dynamics of individuals within the Long House Valley of Arizona from AD 800 to 1350. Individuals are aggregated into households that participate in annual agricultural and demographic cycles. The present version of the model incorporates features of the ALHV model including realistic age-specific fertility and mortality and, in addition, it adds the Black Mesa environment and population, as well as additional methods to allow migration between the two regions.
As is the case for previous versions of the ALHV model as well as the Artificial Anasazi (AA) model from which the ALHV model was derived (Axtell et al. 2002; Janssen 2009), this version makes use of detailed archaeological and paleoenvironmental data from the Long House Valley and the adjacent areas in Arizona. It also uses the same methods as the original AA model to estimate annual maize productivity of various agricultural zones within the Long House Valley. A new environment and associated methods have been developed for Black Mesa. Productivity estimates from both regions are used to determine suitable locations for households and farms during each year of the simulation.
Peer reviewed Gregarious Behavior, Human Colonization and Social Differentiation Agent-Based Model
Gert Jan Hofstede Mark R Kramer Sebastian Fajardo Andrés Bernal Martijn de Vries | Published Thursday, August 20, 2020 | Last modified Thursday, October 29, 2020Studies of colonization processes in past human societies often use a standard population model in which population is represented as a single quantity. Real populations in these processes, however, are structured with internal classes or stages, and classes are sometimes created based on social differentiation. In this present work, information about the colonization of old Providence Island was used to create an agent-based model of the colonization process in a heterogeneous environment for a population with social differentiation. Agents were socially divided into two classes and modeled with dissimilar spatial clustering preferences. The model and simulations assessed the importance of gregarious behavior for colonization processes conducted in heterogeneous environments by socially-differentiated populations. Results suggest that in these conditions, the colonization process starts with an agent cluster in the largest and most suitable area. The spatial distribution of agents maintained a tendency toward randomness as simulation time increased, even when gregariousness values increased. The most conspicuous effects in agent clustering were produced by the initial conditions and behavioral adaptations that increased the agent capacity to access more resources and the likelihood of gregariousness. The approach presented here could be used to analyze past human colonization events or support long-term conceptual design of future human colonization processes with small social formations into unfamiliar and uninhabited environments.
SeaROOTS ABM: Simulating Artificial Hominins Maritime Mobility at Inner Ionian, Greece
Angelos Chliaoutakis | Published Wednesday, May 29, 2024SeaROOTS ABM is a quite generic agent-based modeling system, for simulating and evaluating potential terrestrial and maritime mobility of artificial hominin groups, configured by available archaeological data and hypotheses. Necessary bathymetric, geomorphological and paleoenvironmental data are combined in order to reconstruct paleoshorelines for the study area and produce an archaeologically significant agent environment. Paleoclimatic and archaeological data are incorporated in the ABM in order to simulate maritime crossings and assess the emergent patterns of interaction between human agency and the sea.
SeaROOTS agent-based system includes completely autonomous, utility-based agents (Chliaoutakis & Chalkiadakis 2016), representing artificial hominin groups, with partial knowledge of their environment, for simulating their evolution and potential maritime mobility, utilizing alternative Least Cost Path analysis modeling techniques (Gustas & Supernant 2017, Gravel-Miguel & Wren 2021). Two groups of hominins, Neanderthals and Homo sapiens, are chosen in order to study the challenges and actions employed as a response to the fluctuating sea-levels, as well as probability scenarios with respect to sea-crossings via buoyant vessels (rafting) or the human body itself (swimming). SeaROOTS ABM aims to simulate various scenarios and investigate the degree climatic fluctuations influenced such activities and interactions in the Middle Paleolithic period.
The model focuses on simulating potential terrestrial and maritime routes, explore the interactions and relations between autonomous agents and their environment, as well as to test specific research questions; for example, when and under what conditions would Middle Paleolithic hominins be more likely to attempt a crossing and successfully reach the islands? By which agent type (Sapiens or Neanderthals) and how (e.g. swimming or by sea-vessels) could such short sea crossings be (mostly) attempted, and which (sea) routes were usually considered by the agents? When does a sea-crossing become a choice and when is it a result of forced migration, i.e. disaster- or conflict-induced displacement? Results show that the dynamic marine environment of the Inner Ionian, our case study in this work, played an important role in their decision-making process.
Peer reviewed Organizational behavior in the hierarchy model
Smarzhevskiy Ivan | Published Tuesday, June 18, 2019 | Last modified Wednesday, July 31, 2019In a two-level hierarchical structure (consisting of the positions of managers and operators), persons holding these positions have a certain performance and the value of their own (personal perception in this, simplified, version of the model) perception of each other. The value of the perception of each other by agents is defined as a random variable that has a normal distribution (distribution parameters are set by the control elements of the interface).
In the world of the model, which is the space of perceptions, agents implement two strategies: rapprochement with agents that perceive positively and distance from agents that perceive negatively (both can be implemented, one of these strategies, or neither, the other strategy, which makes the agent stationary). Strategies are implemented in relation to those agents that are in the radius of perception (PerRadius).
The manager (Head) forms a team of agents. The performance of the group (the sum of the individual productivities of subordinates, weighted by the distance from the leader) varies depending on the position of the agents in space and the values of their individual productivities. Individual productivities, in the current version of the model, are set as a random variable distributed evenly on a numerical segment from 0 to 100. The manager forms the team 1) from agents that are in (organizational) radius (Op_Radius), 2) among agents that the manager perceives positively and / or negatively (both can be implemented, one of the specified rules, or neither, which means the refusal of the command formation).
Agents can (with a certain probability, given by the variable PrbltyOfDecisn%), in case of a negative perception of the manager, leave his group permanently.
It is possible in the model to change on the fly radii values, update the perception value across the entire population and the perception of an individual agent by its neighbors within the perception radius, and the probability values for a subordinate to make a decision about leaving the group.
You can also change the set of strategies for moving agents and strategies for recruiting a team manager. It is possible to add a randomness factor to the movement of agents (Stoch_Motion_Speed, the default is set to 0, that is, there are no random movements).
…
Displaying 10 of 229 results for "Martin Dribe" clear search