Our mission is to help computational modelers develop, document, and share their computational models in accordance with community standards and good open science and software engineering practices. Model authors can publish their model source code in the Computational Model Library with narrative documentation as well as metadata that supports open science and emerging norms that facilitate software citation, computational reproducibility / frictionless reuse, and interoperability. Model authors can also request private peer review of their computational models. Models that pass peer review receive a DOI once published.
All users of models published in the library must cite model authors when they use and benefit from their code.
Please check out our model publishing tutorial and feel free to contact us if you have any questions or concerns about publishing your model(s) in the Computational Model Library.
Displaying 10 of 1143 results for "Sjoukje A Osinga" clear search
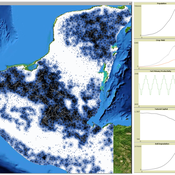
MayaSim: An agent-based model of the ancient Maya social-ecological system
Scott Heckbert | Published Wednesday, July 11, 2012 | Last modified Tuesday, July 02, 2013MayaSim is an agent-based, cellular automata and network model of the ancient Maya. Biophysical and anthropogenic processes interact to grow a complex social ecological system.
Demography, Industry and Residential Choice (DIReC) model
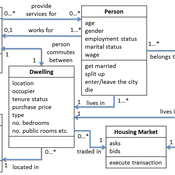
Jiaqi Ge | Published Wednesday, September 04, 2019The integrated and spatially-explicit ABM, called DIReC (Demography, Industry and Residential Choice), has been developed for Aberdeen City and the surrounding Aberdeenshire (Ge, Polhill, Craig, & Liu, 2018). The model includes demographic (individual and household) models, housing infrastructure and occupancy, neighbourhood quality and evolution, employment and labour market, business relocation, industrial structure, income distribution and macroeconomic indicators. DIReC includes a detailed spatial housing model, basing preference models on house attributes and multi-dimensional neighbourhood qualities (education, crime, employment etc.).
The dynamic ABM simulates the interactions between individuals, households, the labour market, businesses and services, neighbourhoods and economic structures. It is empirically grounded using multiple data sources, such as income and gender-age distribution across industries, neighbourhood attributes, business locations, and housing transactions. It has been used to study the impact of economic shocks and structural changes, such as the crash of oil price in 2014 (the Aberdeen economy heavily relies on the gas and oil sector) and the city’s transition from resource-based to a green economy (Ge, Polhill, Craig, & Liu, 2018).
Peer reviewed Urban Transport Mode Choices
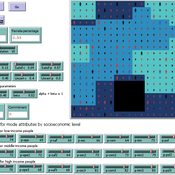
Kathleen Salazar -Serna Lorena Cadavid Carlos Franco | Published Thursday, May 22, 2025The model represents urban commuters’ transport mode choices among cars, public transit, and motorcycles—a mode highly prevalent in developing countries. Using an agent-based modeling approach, it simulates transport dynamics and serves as a testbed for evaluating policies aimed at improving mobility.
The model simulates an ecosystem of human agents who decide, at each time step, which mode of transportation to use for commuting to work. Their decision is based on a combination of personal satisfaction with their most recent journey—evaluated across a vector of individual needs—the information they crowdsource from their social network, and their personal uncertainty regarding trying new transport options.
Agents are assigned demographic attributes such as sex, age, and income level, and are distributed across city neighborhoods according to their socioeconomic status. To represent social influence in decision-making, agents are connected via a scale-free social network topology, where connections are more likely among agents within the same socioeconomic group, reflecting the tendency of individuals to form social ties with similar others.
…
An Agent-Based Model of Flood Risk and Insurance
J Dubbelboer I Nikolic K Jenkins J Hall | Published Monday, July 27, 2015 | Last modified Monday, October 03, 2016A model to show the effects of flood risk on a housing market; the role of flood protection for risk reduction; the working of the existing public-private flood insurance partnership in the UK, and the proposed scheme ‘Flood Re’.
Friendship Games Rev 1.0
David Dixon | Published Friday, October 07, 2011 | Last modified Saturday, April 27, 2013A friendship game is a kind of network game: a game theory model on a network. This is a NetLogo model of an agent-based adaptation of “‘Friendship-based’ Games” by PJ Lamberson. The agents reach an equilibrium that depends on the strategy played and the topology of the network.
BEGET Classic
Kristin Crouse | Published Monday, November 11, 2019 | Last modified Monday, November 25, 2019BEGET Classic includes previous versions used in the classroom and for publication. Please check out the latest version of B3GET here, which has several user-friendly features such as directly importing and exporting genotype and population files.
The classic versions of B3GET include: version one and version three were used in undergraduate labs at the University of Minnesota to demonstrate principles in primate behavioral ecology; version two first demonstrated proof of concept for creating virtual biological organisms using decision-vector algorithms; version four was presented at the 2017 annual meeting at the American Association of Physical Anthropologists; version five was presented in a 2019 publication from the Journal of Human Evolution (Crouse, Miller, and Wilson, 2019).
Narragansett Bay (RI) Recreational Fishery ABM
Tyler Pavlowich Anne Innes-Gold Margaret Heinichen M. Conor McManus Jason McNamee Jeremy Collie Austin Humphries | Published Monday, June 21, 2021This model is based on the Narragansett Bay, RI recreational fishery. The two types of agents are piscivorous fish and fishers (shore and boat fishers are separate “breeds”). Each time step represents one week. Open season is weeks 1-26, assuming fishing occurs during half the year. At each weekly time step, fish agents grow, reproduce, and die. Fisher agents decide whether or not to fish based on their current satisfaction level, and those that do go fishing attempt to catch a fish. If they are successful, they decide whether to keep or release the fish. In our publication, this model was linked to an Ecopath with Ecosim food web model where the commercial harvest of forage fish affected the biomass of piscivorous fish - which then became the starting number of piscivorous fish for this ABM. The number of fish caught in a season of this ABM was converted to a fishing pressure and input back into the food web model.
U-TRANS Modelling Urban Transition with Coupled Housing and Labour Markets
Bernardo Furtado Jiaqi Ge | Published Monday, July 31, 2023We develop an agent-based model (U-TRANS) to simulate the transition of an abstract city under an industrial revolution. By coupling the labour and housing markets, we propose a holistic framework that incorporates the key interacting factors and micro processes during the transition. Using U-TRANS, we look at five urban transition scenarios: collapse, weak recovery, transition, enhanced training and global recruit, and find the model is able to generate patterns observed in the real world. For example, We find that poor neighbourhoods benefit the most from growth in the new industry, whereas the rich neighbourhoods do better than the rest when the growth is slow or the situation deteriorates. We also find a (subtle) trade-off between growth and equality. The strategy to recruit a large number of skilled workers globally will lead to higher growth in GDP, population and human capital, but it will also entail higher inequality and market volatility, and potentially create a divide between the local and international workers. The holistic framework developed in this paper will help us better understand urban transition and detect early signals in the process. It can also be used as a test-bed for policy and growth strategies to help a city during a major economic and technological revolution.
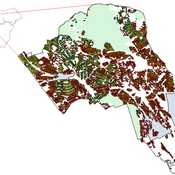
Peer reviewed SWIRS Spread of a woody invader in riparian systems
Moira Zellner Beatriz Sosa Carlos Andrés Chiale | Published Tuesday, May 09, 2023Riparian forests are one of the most vulnerable ecosystems to the development of biological invasions, therefore limiting their spread is one of the main challenges for conservation. The main factors that explain plant invasions in these ecosystems are the capacity for both short- and long-distance seed dispersion, and the occurrence of suitable habitats that facilitate the establishment of the invasive species. Large floods constitute an abiotic filter for invasion.
This model simulates the spatio-temporal spread of the woody invader Gleditsia. triacanthos in the riparian forest of the National Park Esteros de Farrapos e Islas del Río Uruguay, a riparian system in the coast of the Uruguay river (South America). In this model, we represent different environmental conditions for the development of G. triacanthos, long- and short-distance spread of its fruits, and large floods as the main factor of mortality for fruit and early stages.
Field results show that the distribution pattern of this invasive species is limited by establishment, i.e. it spreads locally through the expansion of small areas, and remotely through new invasion foci. This model recreates this dispersion pattern. We use this model to derive management implications to control the spread of G. triacanthos
Interplay between stakeholders of the management of a river
Christophe Sibertin-Blanc Pascal Roggero Bertrand Baldet | Published Wednesday, November 12, 2014This model describes and analyses the outcomes of the confrontation of interests, some conflicting, some common, about the management of a small river in SW France
Displaying 10 of 1143 results for "Sjoukje A Osinga" clear search