Our mission is to help computational modelers develop, document, and share their computational models in accordance with community standards and good open science and software engineering practices. Model authors can publish their model source code in the Computational Model Library with narrative documentation as well as metadata that supports open science and emerging norms that facilitate software citation, computational reproducibility / frictionless reuse, and interoperability. Model authors can also request private peer review of their computational models. Models that pass peer review receive a DOI once published.
All users of models published in the library must cite model authors when they use and benefit from their code.
Please check out our model publishing tutorial and feel free to contact us if you have any questions or concerns about publishing your model(s) in the Computational Model Library.
Displaying 10 of 242 results for "Daniel C Peart" clear search
A replication and extension of the Taylor's Simulation Model of Insurance Market Dynamics in C#
Rei England | Published Sunday, September 24, 2023A simple model is constructed using C# in order to to capture key features of market dynamics, while also producing reasonable results for the individual insurers. A replication of Taylor’s model is also constructed in order to compare results with the new premium setting mechanism. To enable the comparison of the two premium mechanisms, the rest of the model set-up is maintained as in the Taylor model. As in the Taylor example, homogeneous customers represented as a total market exposure which is allocated amongst the insurers.
In each time period, the model undergoes the following steps:
1. Insurers set competitive premiums per exposure unit
2. Losses are generated based on each insurer’s share of the market exposure
3. Accounting results are calculated for each insurer
…
An Agent-Based Model of Insurance Customer Behaviour with Word of Mouth Network in C#
Rei England Iqbal Owadally Douglas Wright | Published Friday, March 04, 2022This is an agent-based model with two types of agents: customers and insurers. Insurers are price-takers who choose how much to spend on their service quality, and customers evaluate insurers based on premium, brand preference, and their perceived service quality. Customers are also connected in a small-world network and may share their opinions with their network.
The ABM contains two types of agents: insurers and customers. These act within the environment of a motor insurance market. At each simulation, the model undergoes the following steps:
- Network generation: At the start of the simulation, the model generates a small world network of social links between the customers, and randomly assigns each customer to an initial insurer ...
Human Resource Management Parameter Experimentation Tool
Carmen Iasiello | Published Thursday, May 07, 2020 | Last modified Thursday, February 25, 2021The agent based model presented here is an explicit instantiation of the Two-Factor Theory (Herzberg et al., 1959) of worker satisfaction and dissatisfaction. By utilizing agent-based modeling, it allows users to test the empirically found variations on the Two-Factor Theory to test its application to specific industries or organizations.
Iasiello, C., Crooks, A.T. and Wittman, S. (2020), The Human Resource Management Parameter Experimentation Tool, 2020 International Conference on Social Computing, Behavioral-Cultural Modeling & Prediction and Behavior Representation in Modeling and Simulation, Washington DC.
epiworldR Type: Fast Agent-Based Epi Models
George G. Vega Yon Derek Meyer | Published Monday, August 26, 2024A flexible framework for Agent-Based Models (ABM), the ‘epiworldR’ package provides methods for prototyping disease outbreaks and transmission models using a ‘C++’ backend, making it very fast. It supports multiple epidemiological models, including the Susceptible-Infected-Susceptible (SIS), Susceptible-Infected-Removed (SIR), Susceptible-Exposed-Infected-Removed (SEIR), and others, involving arbitrary mitigation policies and multiple-disease models. Users can specify infectiousness/susceptibility rates as a function of agents’ features, providing great complexity for the model dynamics. Furthermore, ‘epiworldR’ is ideal for simulation studies featuring large populations.
UK Demographic Simulator
Tony Lawson | Published Monday, February 27, 2012 | Last modified Tuesday, October 21, 2014A dynmaic microsimulation model to project the UK population over time
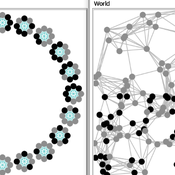
Two agent-based models of cooperation in dynamic groups and fixed social networks
Carlos A. de Matos Fernandes | Published Thursday, January 20, 2022Both models simulate n-person prisoner dilemma in groups (left figure) where agents decide to C/D – using a stochastic threshold algorithm with reinforcement learning components. We model fixed (single group ABM) and dynamic groups (bad-barrels ABM). The purpose of the bad-barrels model is to assess the impact of information during meritocratic matching. In the bad-barrels model, we incorporated a multidimensional structure in which agents are also embedded in a social network (2-person PD). We modeled a random and homophilous network via a random spatial graph algorithm (right figure).
Tyche
Tony Lawson | Published Tuesday, February 28, 2012 | Last modified Saturday, April 27, 2013Demographic microsimulation model used in speed tests against LIAM 2.
Opinion dynamics and collective risk perception: An ABM model of institutional and media communication about disasters - Code and Datasets
danielevilone | Published Tuesday, October 06, 2020The O.R.E. (Opinions on Risky Events) model describes how a population of interacting individuals process information about a risk of natural catastrophe. The institutional information gives the official evaluation of the risk; the agents receive this communication, process it and also speak to each other processing further the information. The description of the algorithm (as it appears also in the paper) can be found in the attached file OREmodel_description.pdf.
The code (ORE_model.c), written in C, is commented. Also the datasets (inputFACEBOOK.txt and inputEMAILs.txt) of the real networks utilized with this model are available.
For any questions/requests, please write me at [email protected]
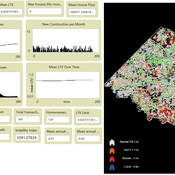
ZIP-Level Housing Supply Elasticity and Crash Dynamics: A GIS-Based Agent-Based Model of the Washington DC and Northern Virginia Metro Region
Mansoor Abdul Bari | Published Saturday, August 01, 2026 | Last modified Sunday, August 02, 2026This model tests whether local housing supply elasticity governs crash severity inside a single metropolitan housing market. Saiz (2010) established that across US metros, regions constrained by geography and regulation experience deeper boom-bust cycles than flexible ones. That finding is routinely applied downward to neighborhoods and ZIP codes as though the mechanism scaled without qualification.
The empirical record for the Washington DC and Northern Virginia region says it does not. Across 84 ZIP codes, measured supply elasticity ranges from 0.35 to 4.95 with a median of 1.21. The worst single-year price decline between 2007 and 2012 averaged 9.6 percent in constrained ZIP codes and 9.0 percent in flexible ones, a gap that cannot be distinguished from noise. Wide variation in the proposed cause, no meaningful separation in the proposed effect.
The model embeds households, houses and a metro-wide credit condition in the real ZIP geography of the region using three GIS layers and an empirical price panel. Local elasticity governs construction, exactly as theory predicts. Prices are driven by a shared macro drift schedule and, under the credit-amplified mode, by a leverage cycle with a financial accelerator and a deviation penalty. The design question is whether those shared forces are sufficient to override local supply differences at the sub-metropolitan scale.
…
The Effectiveness of Image-Scoring Under Different Ecological Conditions
G M Leighton | Published Monday, January 06, 2014The set of models test how receivers ability to accurately rank signalers under various ecological and behavioral contexts.
Displaying 10 of 242 results for "Daniel C Peart" clear search