Our mission is to help computational modelers develop, document, and share their computational models in accordance with community standards and good open science and software engineering practices. Model authors can publish their model source code in the Computational Model Library with narrative documentation as well as metadata that supports open science and emerging norms that facilitate software citation, computational reproducibility / frictionless reuse, and interoperability. Model authors can also request private peer review of their computational models. Models that pass peer review receive a DOI once published.
All users of models published in the library must cite model authors when they use and benefit from their code.
Please check out our model publishing tutorial and feel free to contact us if you have any questions or concerns about publishing your model(s) in the Computational Model Library.
Displaying 10 of 994 results for "Dave van Wees" clear search
Exploring Creativity and Urban Development with Agent-Based Modeling
Ammar Malik Andrew Crooks Hilton Root Melanie Swartz | Published Thursday, October 30, 2014An agent-based model which explores Creativity and Urban Development
Peer reviewed ABM for Social Cohesion and Wellbeing(ABMSCWB)
Taseer Salahuddin Hasan Vergil | Published Wednesday, June 25, 2025ABM model studying impact of social cohesion on wellbeing of a society. Ibn Khaldun’s cyclical theory of history is being used as the theoretical lens along with some other theories. Social cohesion is measured as TSC = (TVE + 2 * (TPI * TPL - TNI * TNL))/((TPI+TNI))
Where
TSC total-social-cohesion ; Variable for social cohesion
TPI total-positive-interactions ; Count of positive interactions
TNI total-negative-interactions ; Count of negative interactions
TPL total-positive-learning ; Count of positive learning outcomes
…
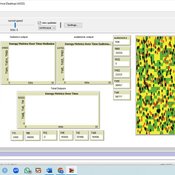
The Effects of Fiscal Targets in a Currency Union: a Multi-Country Agent Based-Stock Flow Consistent Model
Ermanno Catullo Alessandro Caiani Mauro Gallegati | Published Saturday, March 11, 2017We present an Agent-Based Stock Flow Consistent Multi-Country model of a Currency Union to analyze the impact of changes in the fiscal regimes that is permanent changes in the deficit-to-GDP targets that governments commit to comply.
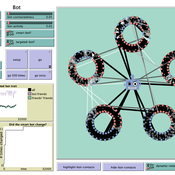
How do bots influence beliefs on social media? Why do beliefs propagated by social bots spread far and wide, yet does their direct influence appear to be limited?
This model extends Axelrod’s model for the dissemination of culture (1997), with a social bot agent–an agent who only sends information and cannot be influenced themselves. The basic network is a ring network with N agents connected to k nearest neighbors. The agents have a cultural profile with F features and Q traits per feature. When two agents interact, the sending agent sends the trait of a randomly chosen feature to the receiving agent, who adopts this trait with a probability equal to their similarity. To this network, we add a bot agents who is given a unique trait on the first feature and is connected to a proportion of the agents in the model equal to ‘bot-connectedness’. At each timestep, the bot is chosen to spread one of its traits to its neighbors with a probility equal to ‘bot-activity’.
The main finding in this model is that, generally, bot activity and bot connectedness are both negatively related to the success of the bot in spreading its unique message, in equilibrium. The mechanism is that very active and well connected bots quickly influence their direct contacts, who then grow too dissimilar from the bot’s indirect contacts to quickly, preventing indirect influence. A less active and less connected bot leaves more space for indirect influence to occur, and is therefore more successful in the long run.
Agent-Based Model of a Circular Food Packaging Ecosystem to assess Packaging Waste Dynamics
Annoek Reitsema | Published Friday, October 11, 2024Reducing packaging waste is a critical challenge that requires organizations to collaborate within circular ecosystems, considering social, economic, and technical variables like decision-making behavior, material prices, and available technologies. Agent-Based Modeling (ABM) offers a valuable methodology for understanding these complex dynamics. In our research, we have developed an ABM to explore circular ecosystems’ potential in reducing packaging waste, using a case study of the Dutch food packaging ecosystem. The model incorporates three types of agents—beverage producers, packaging producers, and waste treaters—who can form closed-loop recycling systems.
Beverage Producer Agents: These agents represent the beverage company divided into five types based on packaging formats: cans, PET bottles, glass bottles, cartons, and bag-in-boxes. Each producer has specific packaging demands based on product volume, type, weight, and reuse potential. They select packaging suppliers annually, guided by deterministic decision styles: bargaining (seeking the lowest price) or problem-solving (prioritizing high recycled content).
Packaging Producer Agents: These agents are responsible for creating packaging using either recycled or virgin materials. The model assumes a mix of monopolistic and competitive market situations, with agents calculating annual material needs. Decision styles influence their choices: bargaining agents compare recycled and virgin material costs, while problem-solving agents prioritize maximum recycled content. They calculate recycled content in packaging and set prices accordingly, ensuring all produced packaging is sold within or outside the model.
…
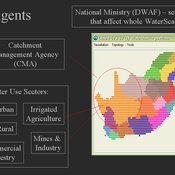
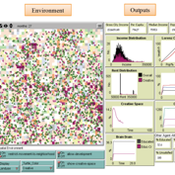
WaterScape
Erin Bohensky | Published Monday, February 06, 2012 | Last modified Saturday, April 27, 2013The WaterScape is an agent-based model of the South African water sector. This version of the model focuses on potential barriers to learning in water management that arise from interactions between human perceptions and social-ecological system conditions.
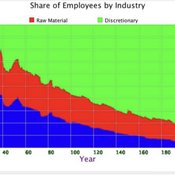
Peer reviewed A Macroeconomic Model of a Closed Economy
Ian Stuart | Published Saturday, May 08, 2021 | Last modified Wednesday, June 23, 2021This model/program presents a “three industry model” that may be particularly useful for macroeconomic simulations. The main purpose of this program is to demonstrate a mechanism in which the relative share of labor shifts between industries.
Care has been taken so that it is written in a self-documenting way so that it may be useful to anyone that might build from it or use it as an example.
This model is not intended to match a specific economy (and is not calibrated to do so) but its particular minimalist implementation may be useful for future research/development.
…
Asymmetric two-sided matching
Naoki Shiba | Published Wednesday, January 09, 2013 | Last modified Tuesday, May 28, 2013This model is an extended version of the matching problem including the mate search problem, which is the generalization of a traditional optimization problem. The matching problem is extended to a form of asymmetric two-sided matching problem.
Model of the social game associated to the production of potato seeds in a Venezuelan region
Christhophe Sibertin-Blanc Ravi Rojas Oswaldo Terán Lisbeth Alarcón Liccia Romero | Published Monday, April 27, 2015 | Last modified Sunday, November 22, 2015This work aims at describing and simulating the (social) game around the production of potato seeds in Venezuela. It shows the effect of the identification of some actors with the production of native potato seeds (e.g., Venezuelan State´s low ident)
Market for Protection
Steven Doubleday | Published Monday, July 01, 2013 | Last modified Monday, August 19, 2013Simulation to replicate and extend an analytical model (Konrad & Skaperdas, 2010) of the provision of security as a collective good. We simulate bandits preying upon peasants in an anarchy condition.
Displaying 10 of 994 results for "Dave van Wees" clear search