Our mission is to help computational modelers develop, document, and share their computational models in accordance with community standards and good open science and software engineering practices. Model authors can publish their model source code in the Computational Model Library with narrative documentation as well as metadata that supports open science and emerging norms that facilitate software citation, computational reproducibility / frictionless reuse, and interoperability. Model authors can also request private peer review of their computational models. Models that pass peer review receive a DOI once published.
All users of models published in the library must cite model authors when they use and benefit from their code.
Please check out our model publishing tutorial and feel free to contact us if you have any questions or concerns about publishing your model(s) in the Computational Model Library.
Displaying 10 of 1132 results for "Oto Hudec" clear search
Food supply chain innovations under public pressure
Tim Verwaart Wil Hennen Jan Buurma | Published Friday, April 15, 2016 | Last modified Tuesday, November 27, 2018Aroused public opinion has led to public debates on social responsibility issues in food supply chains. This model based op opinion dynamics and the linkages between involved actors simulates the public debate leading to the transitions.
Agents with Values and Norms in the Ultimatum Game
rmercuur | Published Wednesday, June 12, 2019This model accompanies a paper looking at the role and limits of values and norms for modeling realistic social agents. Based on literature we synthesize a theory on norms and a theory that combines both values and norms. In contrast to previous work, these theories are checked against data on human behavior obtained from a psychological experiment on dividing money: the ultimatum game. We found that agents that act according to a theory that combines both values and norms, produce behavior quite similar to that of humans. Furthermore, we found that this theory is more realistic than theories solely concerned with norms or theories solely concerned with values. However, to explain the amount of money people accept in this ultimatum game we will eventually need an even more realistic theory. We propose that a theory that explains when people exactly choose to use norms instead of values could provide this realism.
Model of a Socioterritorial complex system - The Southern Rural Territory of Sergipe
Marcos Aurélio Santos da Silva | Published Friday, May 18, 2018The model represents a set of social actors engaged into a collegiate (composed of representants of civil society and public sector) to manage the Southern Rural Territory of Sergipe (SRTS), created by two territorial public policies, the National Program for the Sustainable Development of Rural Territories (PRONAT) and the Program Territories of Citizenship (PTC) which aim at balancing power relations between social actors of Rural Territories. The main gola of these public policies is to empower the civil society engaged in the territory to enable them to negotiate with the traditional power (mainly majors). It was designed two models of the SRTS, one that represents the situation in 2012, and other that represents the social interdependencies in 2017. For each period it is possible to measure the capability and power of each modeled social actor and see whether it is observed the empowerment of the civil society or not.
The Urban Drought Nexus Tool
Roger Cremades Muhamad Khairulbahri | Published Thursday, December 14, 2023The “Urban Drought Nexus Tool” is a system dynamics model, aiming to facilitate the co-development of climate services for cities under increasing droughts. The tool integrates multiple types of information and still can be applied to other case studies with minimal adjustments on the parameters of land use, water consumption and energy use in the water sector. The tool needs hydrological projections under climate scenarios to evaluate climatic futures, and requires the co-creation of socio-economic future scenarios with local stakeholders. Thus it is possible to provide specific information about droughts taking into account future water availability and future water consumption. Ultimately, such complex system as formed by the water-energy-land nexus can be reduced to single variables of interest, e.g. the number of events with no water available in the future and their length, so that the complexities are reduced and the results can be conveyed to society in an understandable way, including the communication of uncertainties. The tool and an explanatory guide in pdf format are included. Planned further developments include calibrating the system dynamics model with the social dynamics behind each flow with agent-based models.
Peer reviewed Urban Transport Mode Choices
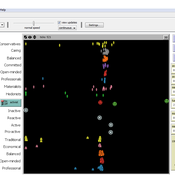
Kathleen Salazar -Serna Lorena Cadavid Carlos Franco | Published Thursday, May 22, 2025The model represents urban commuters’ transport mode choices among cars, public transit, and motorcycles—a mode highly prevalent in developing countries. Using an agent-based modeling approach, it simulates transport dynamics and serves as a testbed for evaluating policies aimed at improving mobility.
The model simulates an ecosystem of human agents who decide, at each time step, which mode of transportation to use for commuting to work. Their decision is based on a combination of personal satisfaction with their most recent journey—evaluated across a vector of individual needs—the information they crowdsource from their social network, and their personal uncertainty regarding trying new transport options.
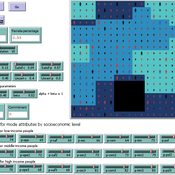
Agents are assigned demographic attributes such as sex, age, and income level, and are distributed across city neighborhoods according to their socioeconomic status. To represent social influence in decision-making, agents are connected via a scale-free social network topology, where connections are more likely among agents within the same socioeconomic group, reflecting the tendency of individuals to form social ties with similar others.
…
An agent-based model of the journey of victim/survivors through local authority domestic abuse support services in the UK
Bruce Edmonds | Published Monday, July 28, 2025This model played a small part in the UK government’s review of the working of local authority implementation of the Domestic Abuse legislation. The model explicitly represents victim-survivor families as they: (a) try to contact the local DA support system, (b) are triaged by the system and (if there is space) allocated to safe temporary accomodation (c) recieve support services from this position and (d) eventually move on to more permenant accomodation. The purpose of the model was to understand some possible ways in which the implementation of DA Duty, might be frustrated in practice, the identification of gaps in the evidence base and to inform the developing Theory of Change. The key measures used for assessing outcomes in the model were the number of families helped and the services that were delivered to them. The exploration was grounded for in two archetypal cases: that of a relatively immature system for the delivery of DA services and a more mature one (based on actual local authority cases, but not based on any single one). See the official report under associated publications for a summary of results.
Concession Forestry Modeling
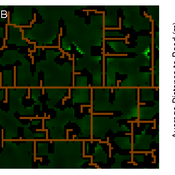
Andrew Bell Daniel G Brown Rick L Riolo Jacqueline M Doremus Thomas P Lyon John Vandermeer Arun Agrawal | Published Thursday, January 23, 2014A logging agent builds roads based on the location of high-value hotspots, and cuts trees based on road access. A forest monitor sanctions the logger on observed infractions, reshaping the pattern of road development.
The Cardial Spread Model
Sean Bergin | Published Friday, September 29, 2017 | Last modified Monday, February 04, 2019The purpose of this model is to provide a platform to test and compare four conceptual models have been proposed to explain the spread of the Impresso-Cardial Neolithic in the west Mediterranean.
Growing Unpopular Norms. A Network-Situated ABM of Norm Choice.
C Merdes | Published Tuesday, November 22, 2016 | Last modified Saturday, March 17, 2018The model’s purpose is to provide a potential explanation for the emergence, sustenance and decline of unpopular norms based on pluralistic ignorance on a social network.
Simulation of the Governance of Complex Systems
Fabian Adelt Johannes Weyer Robin D Fink Andreas Ihrig | Published Monday, December 18, 2017 | Last modified Friday, March 02, 2018Simulation-Framework to study the governance of complex, network-like sociotechnical systems by means of ABM. Agents’ behaviour is based on a sociological model of action. A set of basic governance mechanisms helps to conduct first experiments.
Displaying 10 of 1132 results for "Oto Hudec" clear search