Our mission is to help computational modelers develop, document, and share their computational models in accordance with community standards and good open science and software engineering practices. Model authors can publish their model source code in the Computational Model Library with narrative documentation as well as metadata that supports open science and emerging norms that facilitate software citation, computational reproducibility / frictionless reuse, and interoperability. Model authors can also request private peer review of their computational models. Models that pass peer review receive a DOI once published.
All users of models published in the library must cite model authors when they use and benefit from their code.
Please check out our model publishing tutorial and feel free to contact us if you have any questions or concerns about publishing your model(s) in the Computational Model Library.
Displaying 10 of 74 results for "Maria Angela Echeverry-Galvis" clear search

Peer reviewed HUMLAND: HUMan impact on LANDscapes agent-based model
Fulco Scherjon Anastasia Nikulina Anhelina Zapolska Maria Antonia Serge Marco Davoli Dave van Wees Katharine MacDonald | Published Monday, October 16, 2023The HUMan impact on LANDscapes (HUMLAND) model has been developed to track and quantify the intensity of different impacts on landscapes at the continental level. This agent-based model focuses on determining the most influential factors in the transformation of interglacial vegetation with a specific emphasis on burning organized by hunter-gatherers. HUMLAND integrates various spatial datasets as input and target for the agent-based model results. Additionally, the simulation incorporates recently obtained continental-scale estimations of fire return intervals and the speed of vegetation regrowth. The obtained results include maps of possible scenarios of modified landscapes in the past and quantification of the impact of each agent, including climate, humans, megafauna, and natural fires.
Peer reviewed Horse population dynamics
Nika Galic | Published Tuesday, November 12, 2013 | Last modified Wednesday, October 29, 2014This model investigates the link between prescribed growth in body size, population dynamics and density dependence through population feedback on available resources.
Evolutionary Model of Subculture Choice
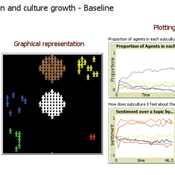
Diogo Alves | Published Monday, December 19, 2022This is an original model of (sub)culture diffusion.
It features a set of agents (dubbed “partygoers”) organized initially in clusters, having properties such as age and a chromosome of opinions about 6 different topics. The partygoers interact with a set of cultures (also having a set of opinions subsuming those of its members), in the sense of refractory or unhappy members of each setting about to find a new culture and trading information encoded in the genetic string (originally encoded as -1, 0, and 1, resp. a negative, neutral, and positive opinion about each of the 6 traits/aspects, e.g. the use of recreational drugs). There are 5 subcultures that both influence (through the aforementioned genetic operations of mutation and recombination of chromosomes simulating exchange of opinions) and are influenced by its members (since a group is a weighted average of the opinions and actions of its constituents). The objective of this feedback loop is to investigate under which conditions certain subculture sizes emerge, but the model is open to many other kinds of explorations as well.
Peer reviewed MicroAnts 2.5
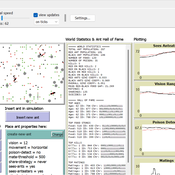
Diogo Alves | Published Thursday, October 16, 2025MicroAnts 2.5 is a general-purpose agent-based model designed as a flexible workhorse for simulating ecological and evolutionary dynamics in artificial populations, as well as, potentially, the emergence of political institutions and economic regimes. It builds on and extends Stephen Wright’s original MicroAnts 2.0 by introducing configurable predators, inequality tracking, and other options.
Ant agents are of two tyes/casts and controlled by 16-bit chromosomes encoding traits such as vision, movement, mating thresholds, sensing, and combat strength. Predators (anteaters) operate in static, random, or targeted predatory modes. Ants reproduce, mutate, cooperate, fight, and die based on their traits and interactions. Environmental pressures (poison and predators) and social dynamics (sharing, mating, combat) drive emergent behavior across red and black ant populations.
The model supports insertion of custom agents at runtime, configurable mutation/inversion rates, and exports detailed statistics, including inequality metrics (e.g., Gini coefficients), trait frequencies, predator kills, and lineage data. Intended for rapid testing and educational experimentation, MicroAnts 2.5 serves as a modular base for more complex ecological and social simulations.
Gunpowder battle tactics
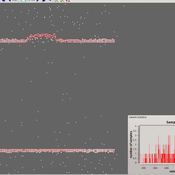
Xavier Rubio-Campillo Jose María Cela Francesc Xavier Hernàndez | Published Wednesday, November 20, 2013 | Last modified Tuesday, November 26, 2013This model simulates the dynamics of eighteenth-century infantry battle tactics. The goal is to explore the effect of different tactics and individual traits in the dynamics of the combat.
A Bottom-Up Simulation on Competition and Displacement of Online Interpersonal Communication Platforms
great-sage-futao | Published Tuesday, December 31, 2019 | Last modified Tuesday, December 31, 2019This model aims to simulate Competition and Displacement of Online Interpersonal Communication Platforms process from a bottom-up angle. Individual interpersonal communication platform adoption and abandonment serve as the micro-foundation of the simulation model. The evolution mode of platform user online communication network determines how present platform users adjust their communication relationships as well as how new users join that network. This evolution mode together with innovations proposed by individual interpersonal communication platforms would also have impacts on the platform competition and displacement process and result by influencing individual platform adoption and abandonment behaviors. Three scenes were designed to simulate some common competition situations occurred in the past and current time, that two homogeneous interpersonal communication platforms competed with each other when this kind of platforms first came into the public eye, that a late entrant platform with a major innovation competed with the leading incumbent platform during the following days, as well as that both the leading incumbent and the late entrant continued to propose many small innovations to compete in recent days, respectively.
Initial parameters are as follows: n(Nmax in the paper), denotes the final node number of the online communication network node. mi (m in the paper), denotes the initial degree of those initial network nodes and new added nodes. pc(Pc in the paper), denotes the proportion of links to be removed and added in each epoch. pst(Pv in the paper), denotes the proportion of nodes with a viscosity to some platforms. comeintime(Ti in the paper), denotes the epoch when Platform 2 joins the market. pit(Pi in the paper), denotes the proportion of nodes adopting Platform 2 immediately at epoch comeintime(Ti). ct(Ct in the paper), denotes the Innovation Effective Period length. In Scene 2, There is only one major platform proposed by Platform 2, and ct describes that length. However, in Scene 3, Platform 2 and 1 will propose innovations alternately. And so, we set ct=10000 in simulation program, and every jtt epochs, we alter the innovation proposer from one platform to the other. Hence in this scene, jtt actually denotes the Innovation Effective Period length instead of ct.
A simple agent-based spatial model of the economy
Bernardo Alves Furtado Isaque Daniel Rocha Eberhardt | Published Thursday, March 10, 2016 | Last modified Tuesday, November 22, 2016The modeling includes citizens, bounded into families; firms and governments; all of them interacting in markets for goods, labor and real estate. The model is spatial and dynamic.
Quality uncertainty and market failure
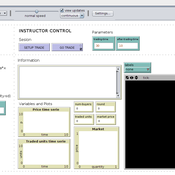
David Poza José Manuel Galán María Pereda José Santos | Published Wednesday, May 14, 2014 | Last modified Wednesday, April 25, 2018Quality uncertainty and market failure: an interactive model to conduct classroom experiments
Threshold Public Goods Game Models with Punishment
Martin Zoričak Vladimir Gazda Gabriela Koľveková Manuela Raisová | Published Saturday, June 06, 2020This is a set of threshold public goods games models. Set consists of baseline model, endogenous shared punishment model, endogenous shared punishment model with activists and cooperation model. In each round, all agents are granted a budget of size set in GUI. Then they decide on how much they contribute to public goods and how much they keep. Public goods are provided only if the sum of contributions meets or exceeds the threshold defined in the GUI. After each round agents evaluate their strategy and payoff from this strategy.
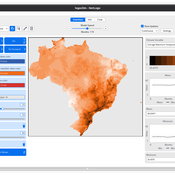
LogoClim: WorldClim in NetLogo
Daniel Vartanian Leandro Garcia Aline Martins de Carvalho Aline | Published Thursday, July 03, 2025 | Last modified Monday, July 13, 2026LogoClim is a NetLogo model designed to be integrated into other simulations through the LevelSpace extension (Hjorth et al., 2020), providing high resolution climate data from sources validated and used by the Intergovernmental Panel on Climate Change (IPCC).
The model simplifies and standardizes the integration of climate data into NetLogo, allowing researchers to focus their efforts on the model itself with the assurance of using reliable and widely recognized data. Although its main use is as a component of larger simulations, LogoClim also has its own graphical interface for monitoring and checking the datasets.
The climate data comes from the WorldClim 2.1 project (Fick & Hijmans, 2017), for which LogoClim works as an interface to NetLogo. The model supports all three WorldClim data series: (1) Historical Climate Data (1970 to 2000), with 12 monthly points for minimum, mean, and maximum temperature, precipitation, solar radiation, wind speed, vapor pressure, elevation, and bioclimatic variables; (2) Historical Monthly Weather Data (1951 to 2024), based on downscaling of CRU-TS-4.09, developed by the Climatic Research Unit at the University of East Anglia (Harris et al., 2020), with minimum and maximum temperature and total precipitation; and (3) Future Climate Data, based on downscaling climate projections derived from global climate models of the Coupled Model Intercomparison Project Phase 6 (CMIP6) (Eyring et al., 2016) for four future periods (2021 to 2040, 2041 to 2060, 2061 to 2080, and 2081 to 2100) and four scenarios based on the Shared Socioeconomic Pathways (SSPs 126, 245, 370, and 585), covering minimum and maximum temperature, total precipitation, and bioclimatic variables. All series are available at multiple spatial resolutions, from 10 minutes (about 340 km² at the equator) to 30 seconds (about 1 km² at the equator).
…
Displaying 10 of 74 results for "Maria Angela Echeverry-Galvis" clear search